Production-ready AI with Built-in Governance
Trussed is the enterprise AI control plane that enforces governance at runtime across AI apps, agents, and developer tools, turning static policies into real-time control.






Free compliance tools
Not sure where to start?
Measure your readiness across governance, security, compliance, runtime controls, and agentic AI, then track every regulatory deadline that applies to you.
Take the AssessmentEnterprise AI is outpacing the systems meant to govern it
Modern AI systems no longer stop at prompts and model responses.
Agents now query databases, retrieve records, trigger workflows, modify systems, and interact with enterprise infrastructure through MCP servers and tool calls. Traditional AI governance focuses on what models say. Enterprises also need governance over what agents do.
Ungoverned tool access
Agents can access sensitive systems and data through MCP tools.
Invisible operational behavior
Organizations may govern model outputs while remaining blind to runtime actions.
Data leakage and compliance exposure
Tool responses may contain regulated or sensitive information.
Uncontrolled workflows
Agents can trigger actions across systems without policy enforcement.
Fragmented visibility
Model interactions, tool activity, and workflows are often disconnected across systems.
Shadow AI
Employees are using AI tools, sanctioned and unsanctioned, that your security and compliance teams can't see. Every unmonitored session is a potential data leak.
Govern the full AI execution path
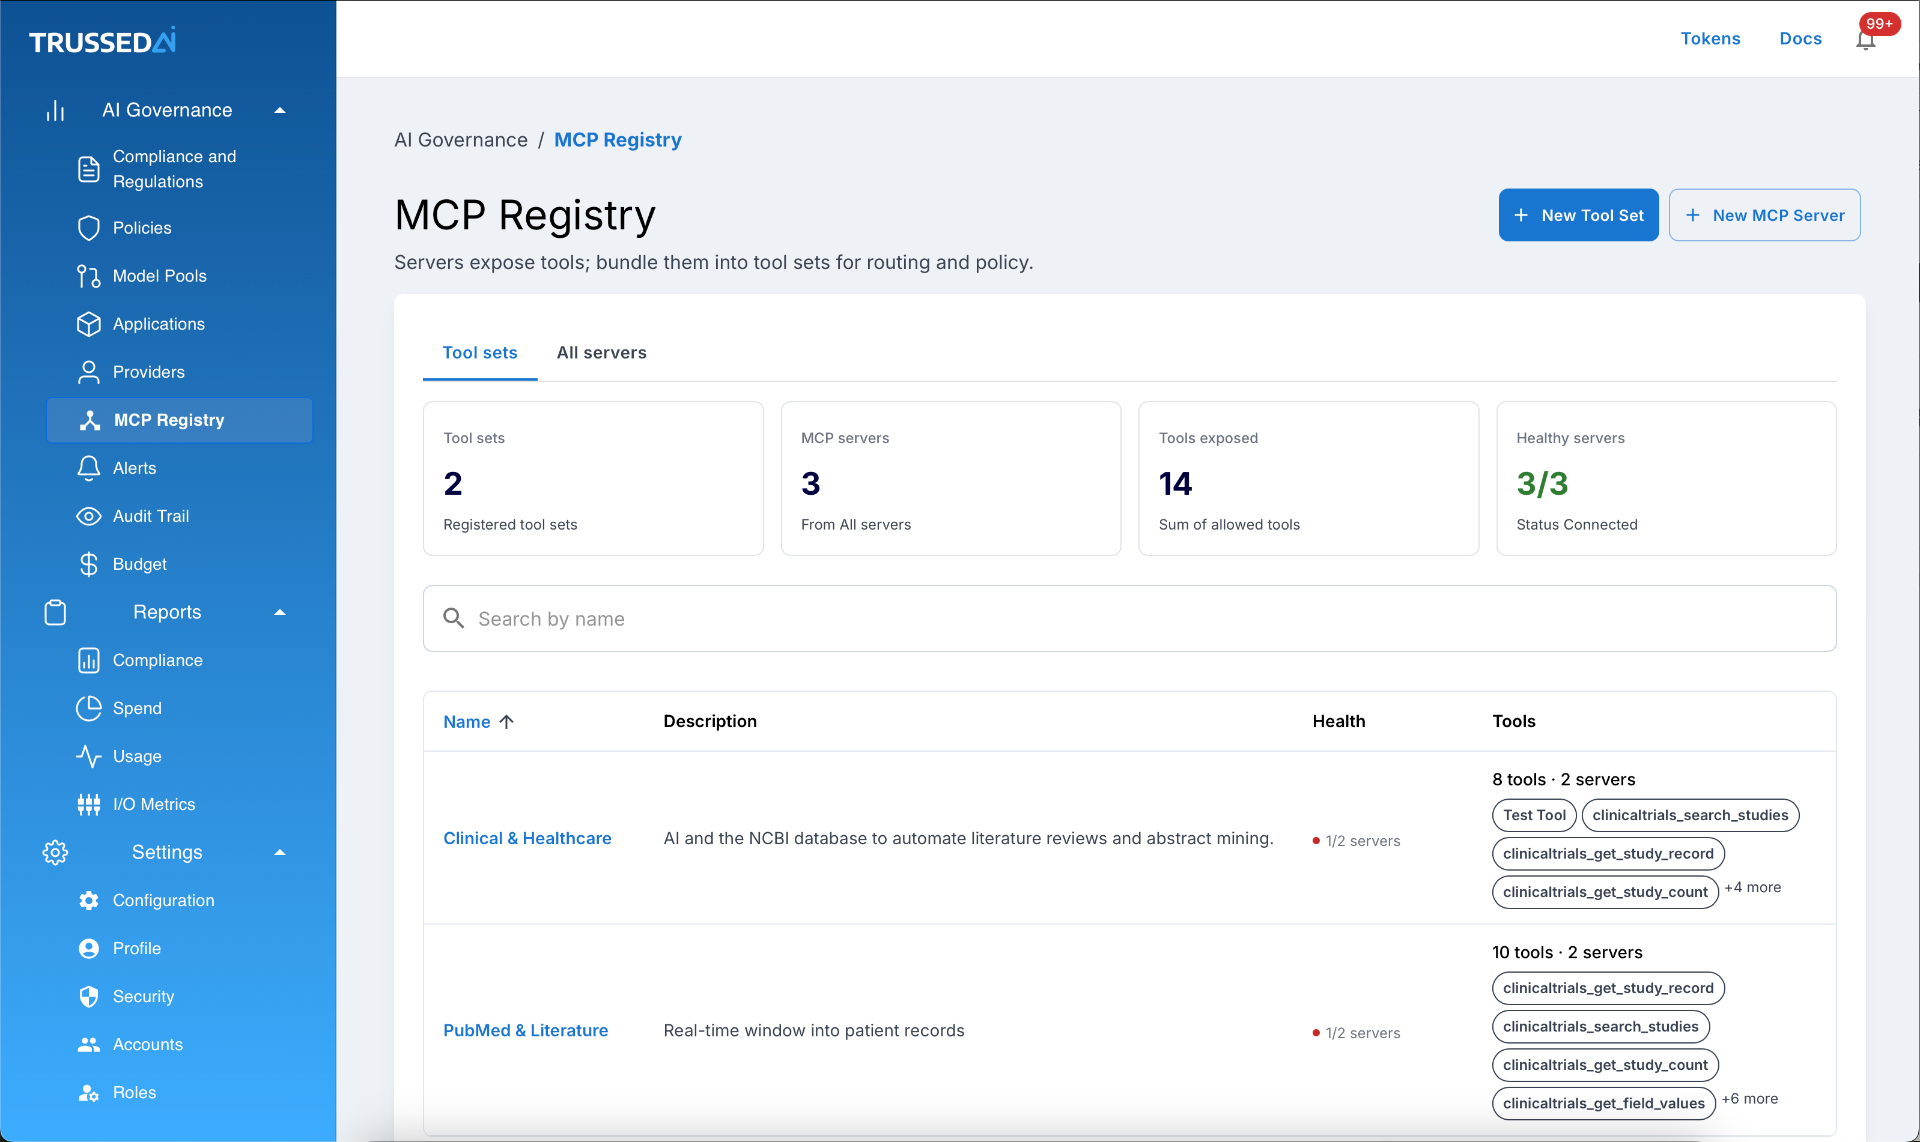
Trussed sits between agents, MCP servers, enterprise tools and models: providing centralized governance, observability, and runtime enforcement across every interaction.
Govern MCP servers and tool interactions
MCP servers allow AI agents to interact with enterprise systems and operational infrastructure.
Examples of MCP servers
Google Docs
Document creation, editing, summarization
Google Slides
Presentation management, content updates
Salesforce
CRM access, customer records, workflow automation
GitHub
Repositories, pull requests, code management
Slack
Messaging, notifications, collaboration
Databases
Querying, updating, retrieving operational data
Internal APIs
Custom business processes and enterprise actions
Tools exposed
Each MCP server exposes specific tools agents can invoke during execution.
Google Docs MCP server
Google Slides MCP server
Agents can chain multiple tools together within a workflow, reading information, modifying content, triggering actions, and updating systems autonomously.
Trussed governs these interactions in real time.
Platform Capabilities
Everything you need to run AI safely, reliably, and cost-effectively in production.
Runtime governance
Tool-level enforcement
Runtime inspection
Workflow governance
Observability and auditability
A control layer integrated into your AI stack
Trussed sits in the flow of AI interactions, providing real-time visibility and control without disrupting existing systems.
Connect your AI ecosystem
Integrate with your models, applications, agents, MCP servers, and developer tools as a proxy through public APIs.
Define policies and guardrails
Configure governance, security, compliance, and usage policies aligned with organizational and regulatory requirements.
Enforce in real time
Every AI interaction and MCP tool call is monitored and evaluated at runtime. Policies are enforced instantly across models, agents, MCP servers, workflows, and enterprise systems, with intelligent routing and failover to maintain reliability.
Observe, audit, and optimize
Gain continuous visibility into usage, risks, costs, performance, and operational behavior with audit-ready records and actionable insights.
Manage data and maintain compliance
Manage prompts, responses, MCP payloads, and metadata with configurable retention, data residency controls, and secure access policies. Maintain complete audit trails and verifiable compliance evidence for internal reviews and regulatory investigations.
Built for regulated enterprises
Trussed enforces governance, security, and compliance across both model interactions and agent-to-tool workflows.
Runtime guardrails
Protect sensitive data and apply runtime guardrails across both model interactions and agent-to-tool workflows.
Visibility across AI and infrastructure
Maintain visibility into how AI systems interact with enterprise infrastructure, MCP servers, and tools.
Compliance as an outcome
Compliance becomes the outcome of continuous governance and enforcement, not a separate operational process.
Built for developers
Integrate in minutes with our SDKs. Just swap your API endpoint, Trussed works as a drop-in proxy with zero changes to your application code.
import trussed from "@trussed/sdk";const client = trussed.init({ apiKey: process.env.TRUSSED_API_KEY,});// Route through Trussed with built-in policiesconst response = await client.chat.completions.create({ model: "gpt-4", messages: [{ role: "user", content: prompt }], policies: ["pii-redaction", "cost-limit"],});Run AI safely in production
Join enterprises that trust Trussed to govern, secure, and optimize their AI infrastructure.